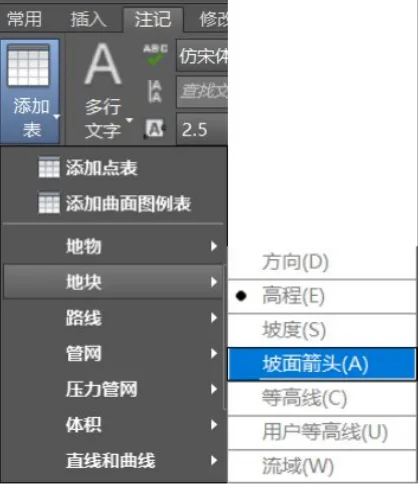
Surface analysis in Civil 3D encompasses various methods, including contour lines, direction, elevation, slope, slope arrows, user-defined contour lines, and watersheds, as illustrated in Figure 1.
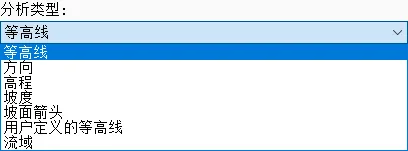
Figure 1: Types of Surface Analysis
Contour analysis involves color-coding contour lines based on their elevation ranges. Directional analysis differentiates and colors triangles on a curved surface according to the direction they face.
Elevation analysis renders the surface into layers and zones based on the elevation range of its triangles. Slope analysis segments and colors the surface according to the slope ranges of the triangles.
Slope arrow analysis places arrows at the centroid of triangles, colored by specified slope ranges, to aid in slope interpretation. User-defined contour analysis allows designers to customize contour lines’ elevation ranges and apply color rendering accordingly.
Watershed analysis divides a watershed into differently colored zones based on its type.
In road engineering design, elevation-related analyses assist designers in developing horizontal and vertical road plans, minimizing cut and fill volumes, and reducing construction costs. Watershed analysis helps determine drainage flow directions, while slope direction correlation analysis guides the selection of road alignment. For example, to prevent ice formation and thawing issues in winter, it’s advisable to orient roads toward the sunnier side.
Using elevation analysis as an example, start by creating a new surface style named “Elevation Analysis” in the Toolspace tab under the Settings directory, as shown in Figure 2.
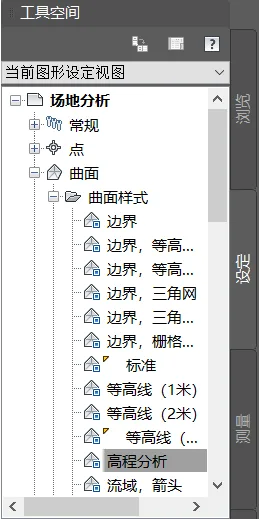
Figure 2: Creating a New Elevation Analysis Surface Style
Expand the “Analysis” section under the surface style settings. Set the scheme to “Rainbow Color” and the display type to “2D Solid” (viewable only in plan view; for 3D views, set to “3D Face”). Then, set the direction display mode to “Use Surface Elevation,” as shown in Figure 3.
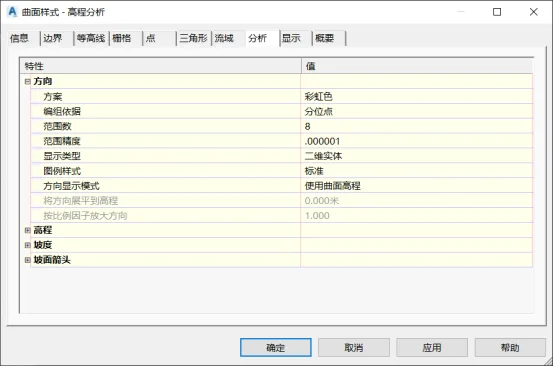
Figure 3: Settings for Elevation Analysis Surface Style
Next, switch to the display window, set the planar view direction to show only elevation, then confirm to complete the surface style creation, as shown in Figure 4.
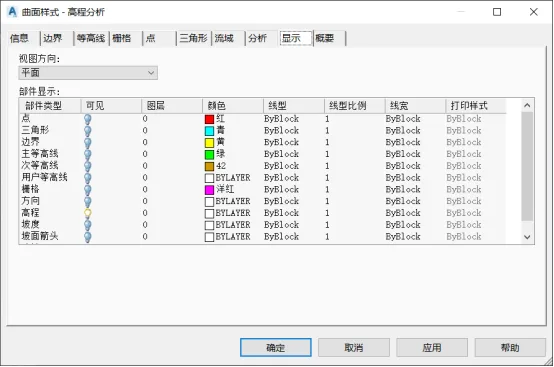
Figure 4: Display Settings for Elevation Analysis Surface Style
Select the surface object you want to analyze. Right-click to open the Surface Properties dialog box, and in the information panel, set the surface style to your newly created elevation analysis style, as shown in Figure 5.
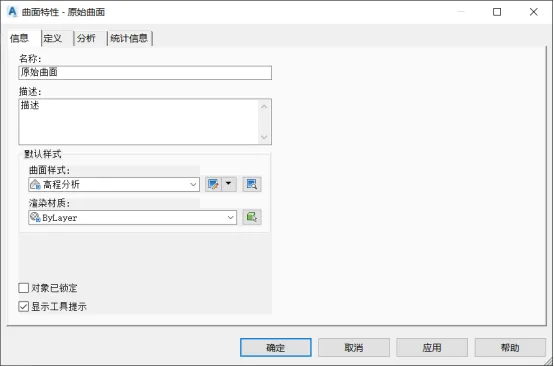
Figure 5: Setting Surface Styles
Then, open the analysis dialog box, choose the elevation analysis type, click the elevation analysis button, confirm your selection, and view the results in plan view, as shown in Figure 6.
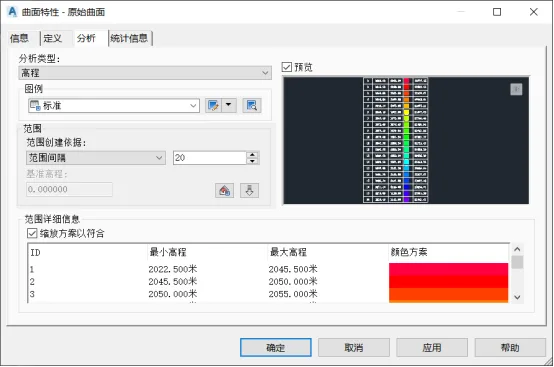
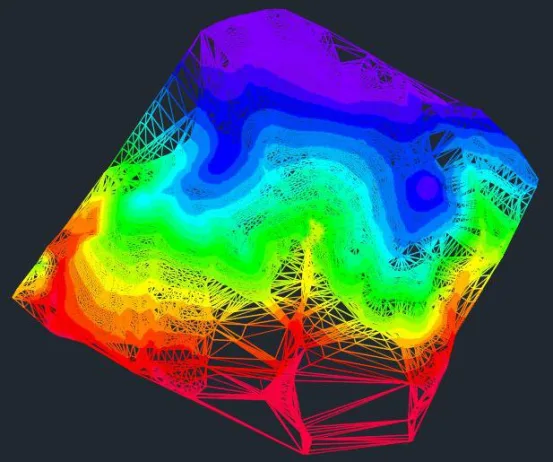
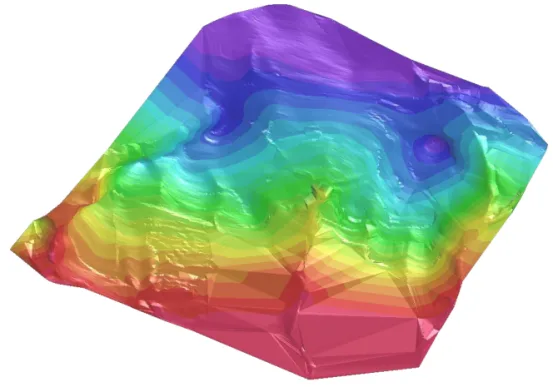
Figure 6: Surface Elevation Analysis
To add a legend, go to the Annotation tab, select “Add Table,” and then click “Add Surface Legend Table.” Follow the prompts on the command bar to choose the elevation option and dynamically place the legend in your drawing, as shown in Figure 7.
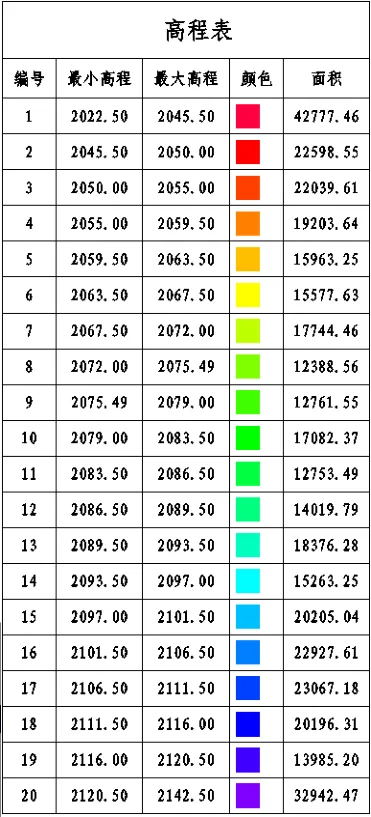
The elevation table provides detailed information about the elevation intervals and their corresponding color-coded areas. The process for creating watershed analysis follows a similar procedure, as shown in Figure 8.
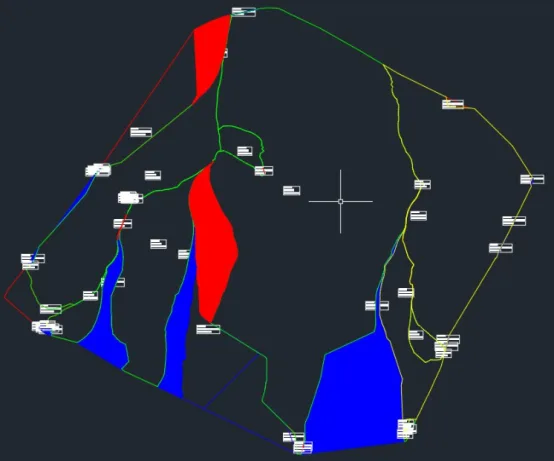
Figure 8: Watershed Analysis
Yang Long (Jilin University of Architecture)
For educational and communication purposes only. Copyright belongs to the original author. If there is any infringement, please contact us for removal.


Must log in before commenting!
Sign Up