Article source: Big Talk Traffic ABC

Synchro is a popular urban transportation network modeling and analysis software that integrates road network modeling and microsimulation with a 3D viewer. It offers professional traffic flow analysis, optimization, and simulation capabilities. When running traffic simulations, its built-in SimTraffic module generates various performance indicators for the road network, providing practical insights. Key functions of the software include:
1. Analysis and simulation of road traffic capacity;
2. Optimization and control of intersection signal timing;
3. Interfaces with other traffic simulation software like CORSIM and TRANSYT for collaborative traffic modeling.
The Synchro software interface is shown in Figure 1:
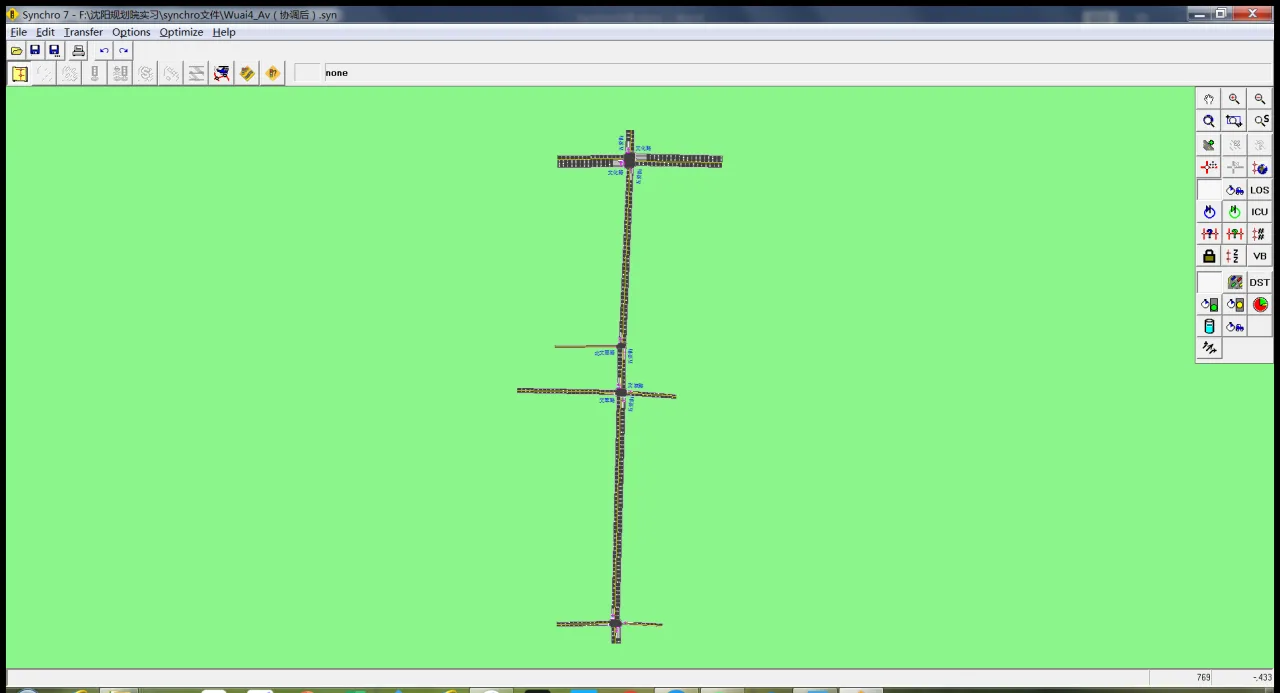
Figure 1: Synchro software interface
This article will explain Synchro’s operation and features from three perspectives: road network drawing and scale settings, signal timing and green wave output, and mainline simulation with performance indicator output.
1. Road Network Drawing and Scale Settings
To draw a road segment (Link), click the “Add Link” button in the toolbar on the right side of the interface. Then left-click and drag the mouse to create the road section. Synchro draws all roads as two-way streets, regardless of the drag direction. An example of a drawn road section is shown in Figure 2:
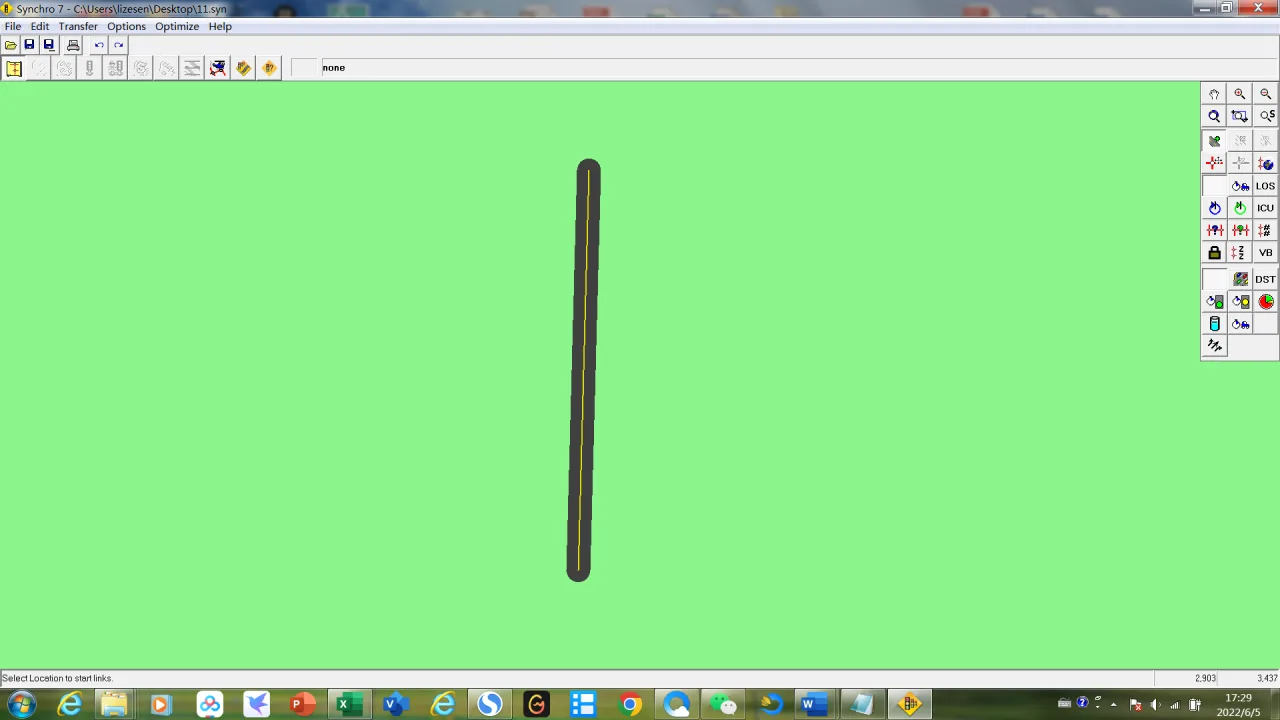
Figure 2: Road section drawn using Synchro
After drawing a road section, click the “Lane Settings” button in the toolbar above to configure lane attributes such as the number of lanes, vehicle speed, and lane width. An example of the lane parameter settings is shown in Figure 3:

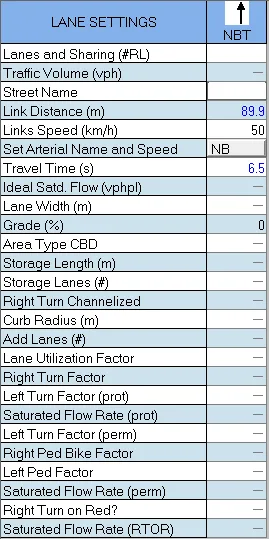
Figure 3: Parameter settings for road sections
If you plan to use this road section as a reference to draw a main road or network, ensure the actual distances match those on the base map. To do this, you need to set the scale by importing a base map. Go to the “File” dropdown menu, select “Background,” and enter the scale bar setting interface.
First, select reference points in the road network that correspond to points on the map, as shown in Figures 4(a) and 4(b):
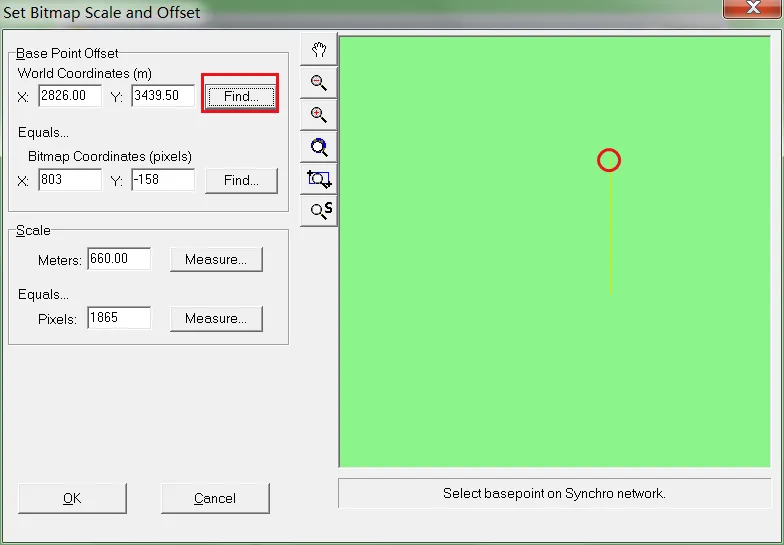
Figure 4(a): Step 1 of reference point selection
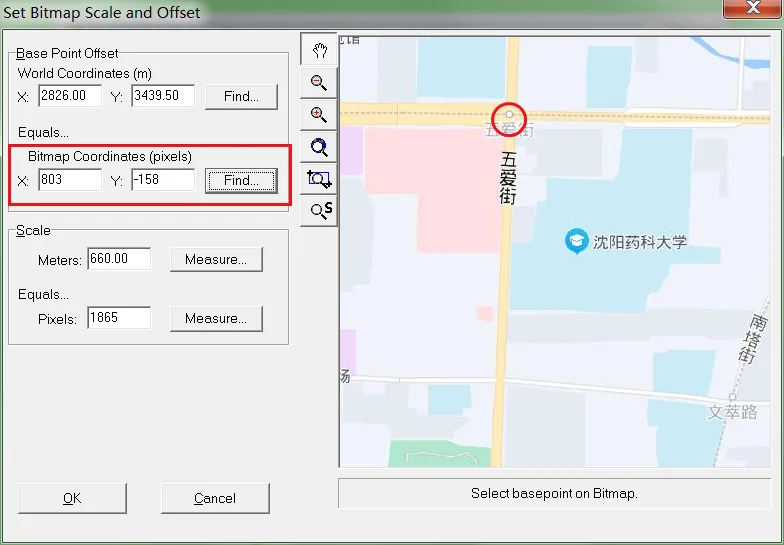
Figure 4(b): Step 2 of reference point selection
Next, select the distance between two points on the drawn road that correspond to the actual map’s midpoint, then click “OK” to complete the proportional import of the base map, as shown in Figures 5(a) and 5(b):
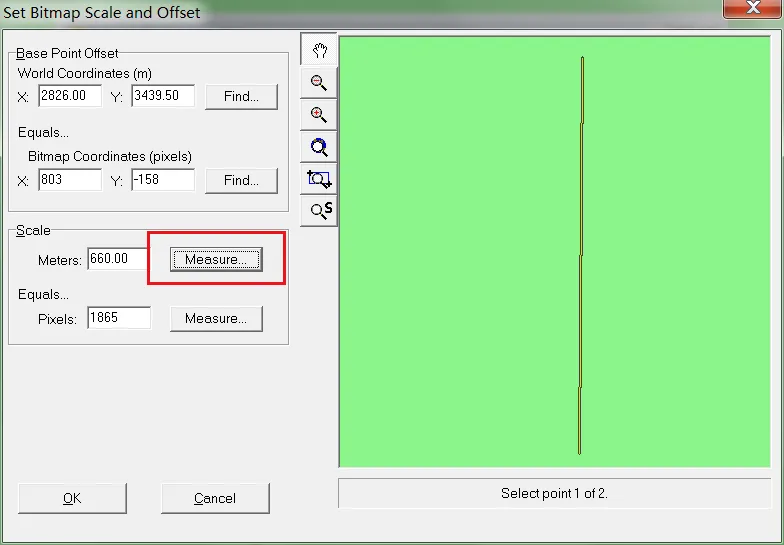
Figure 5(a): Step 1 of importing proportional base map
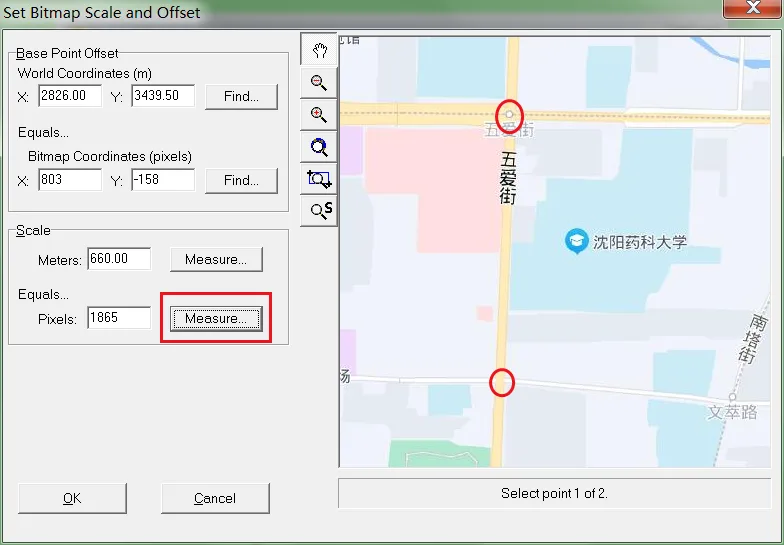
Figure 5(b): Step 2 of importing proportional base map
The corresponding road section on the base map is shown in Figure 6:
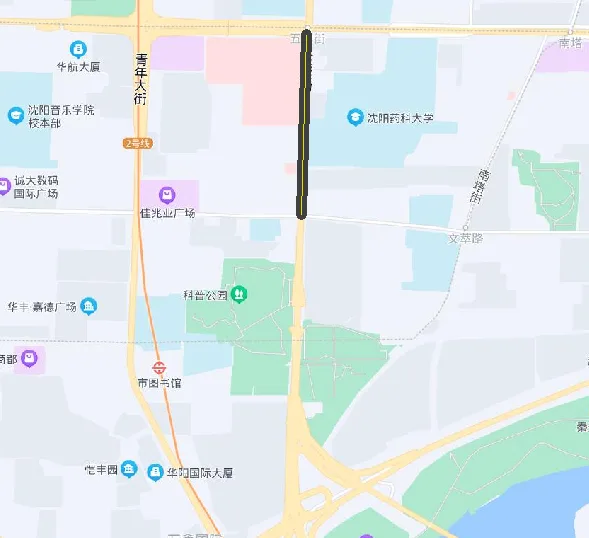
Figure 6: Road segment aligned with the base map
2. Signal Timing Settings and Green Wave Output
Once the main roads and network are drawn, you can input signal timing parameters for each intersection. Click the “Timing Settings” button in the toolbar to open the intersection signal timing interface, shown in Figure 7:
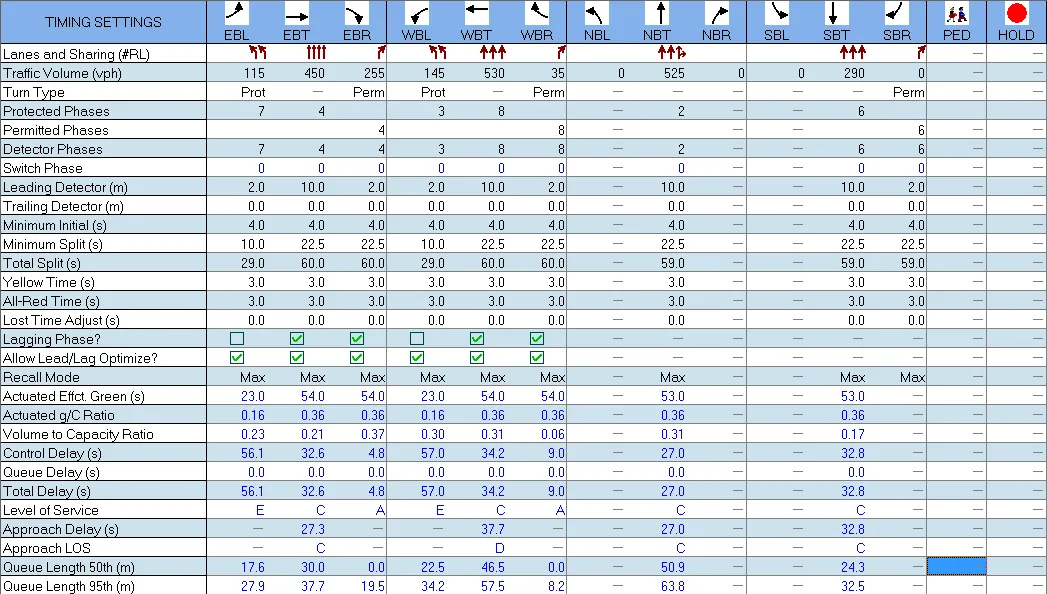
Figure 7: Intersection signal timing input interface
In this interface, you can enter lane counts and traffic flow data for each approach. Following the NEMA phase numbering standard, assign phase numbers to control left turns and straight-through movements. Define the total duration for green, yellow, and all-red intervals under “Total Split,” and separately set the yellow and all-red durations.
To generate coordinated green waves along the mainline, set the absolute phase difference for each intersection. Double-click the intersection, and in the “Node Settings” panel, select the reference phase according to NEMA phase numbers. Mark the “Master Intersection” checkbox for the reference node, then enter the phase offset in the “Offset” field. The interface is shown in Figure 8:
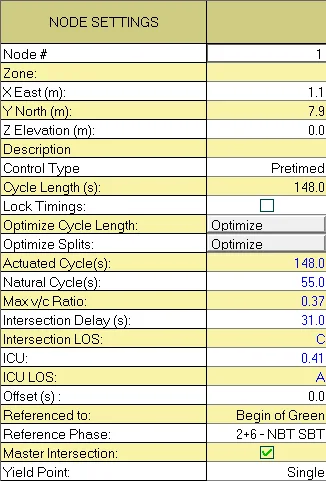
Figure 8: Phase difference settings for intersections along the mainline
After setting the phase offsets, click the “Time Space Diagram” button in the toolbar to generate the mainline green wave bandwidth diagram, as shown in Figure 9:
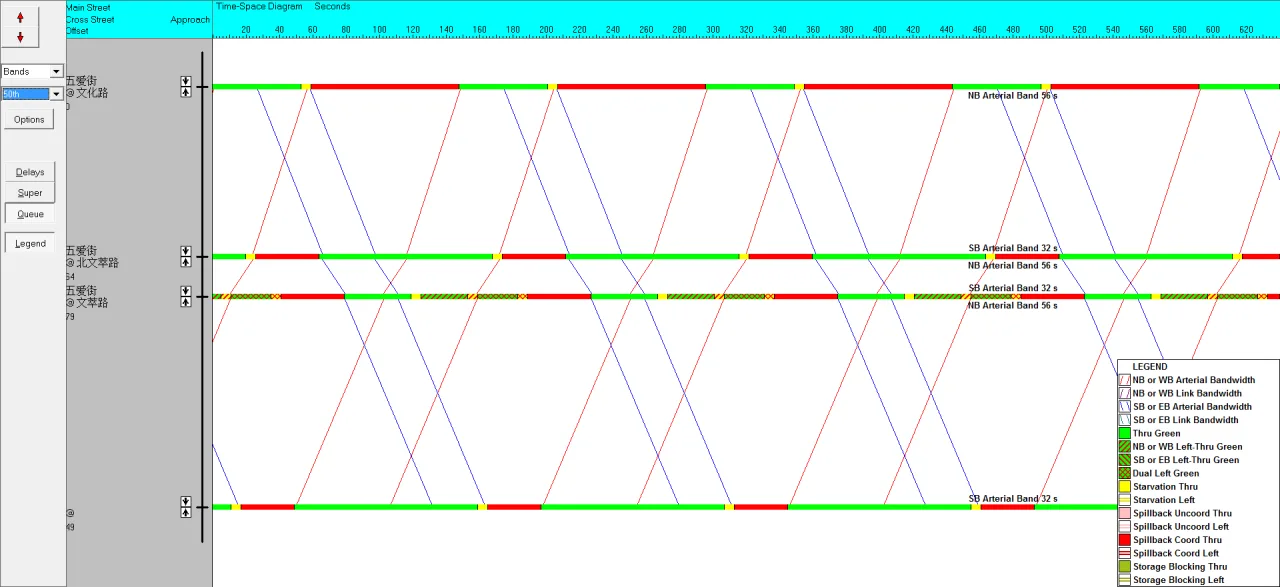
Figure 9: Mainline green wave bandwidth output
3. Mainline Simulation and Performance Indicator Output
To evaluate the overall optimization effects after coordination, use Synchro’s SimTraffic module to simulate the mainline. The process steps are as follows:
Step 1: Click the “SimTraffic Animation” button in the toolbar to open the SimTraffic simulation interface, as shown in Figure 10:
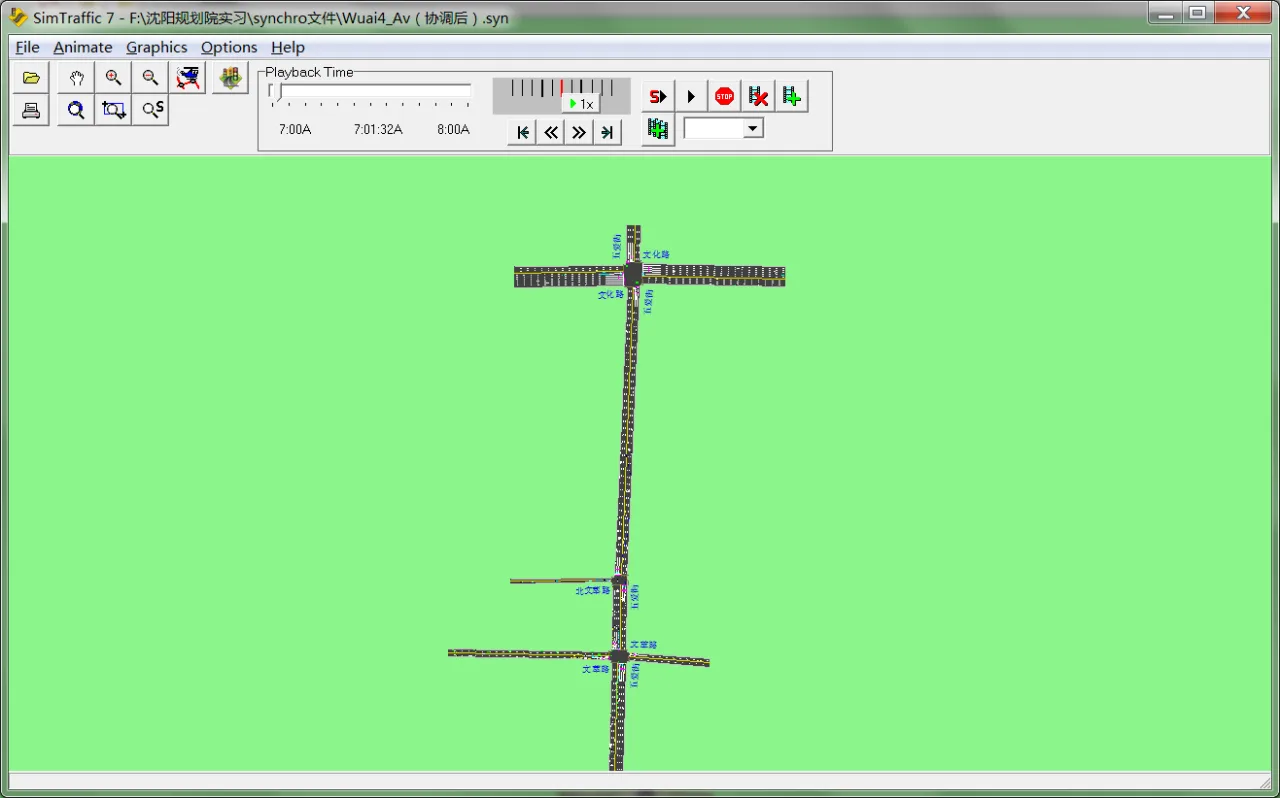
Figure 10: SimTraffic simulation interface
Step 2: Set the simulation start time and duration. Access the “Intervals and Volumes” function under the “Options” menu to input runtime settings. For example, select morning peak traffic from 7:00 to 8:00 AM by setting the “Start time” to 07:00A and the “Duration” to 60 minutes. Click “OK” to confirm, as shown in Figure 11:
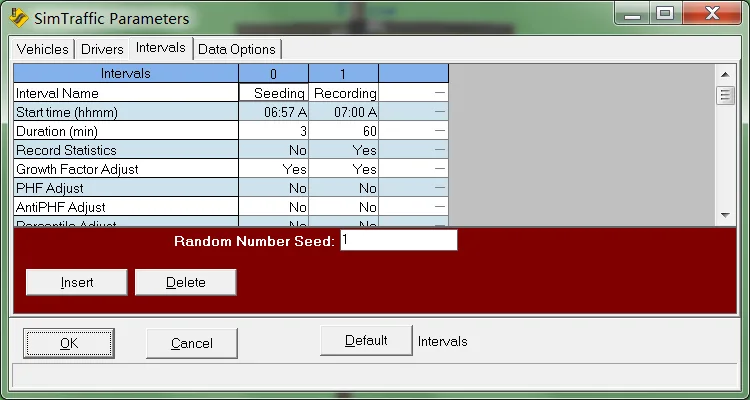
Figure 11: Start time and duration settings interface
Step 3: Run the simulation for the selected mainline by clicking the appropriate button, as shown in Figure 12:
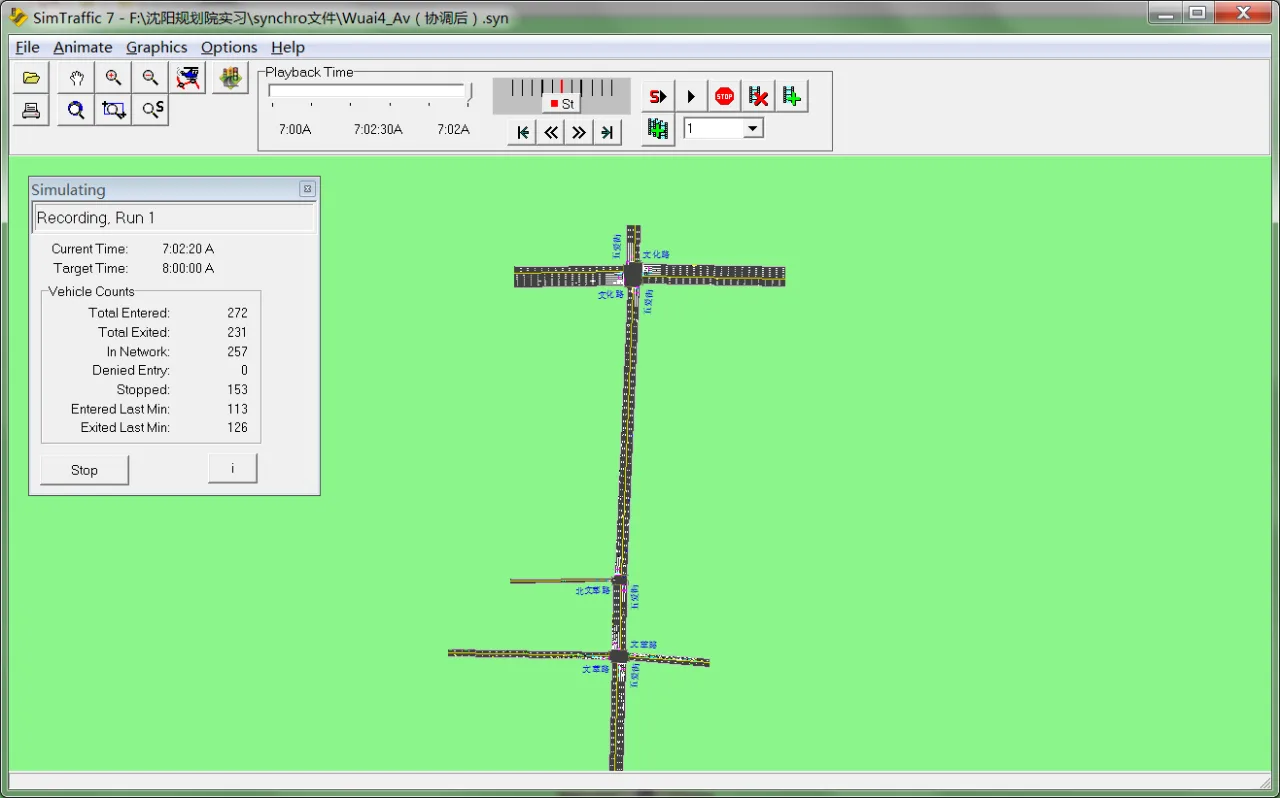
Figure 12: SimTraffic simulation in progress
After completing the simulation, a .sim file is automatically saved in the same folder as the .syn file within Synchro.
Step 4: Configure output parameters. Go to the “Report” function under the “File” menu, select the desired variables from “MOEs to include” in the “Performance Report Options,” then click “Save Text” to generate a report file based on the simulation data. The output settings interface is shown in Figure 13:
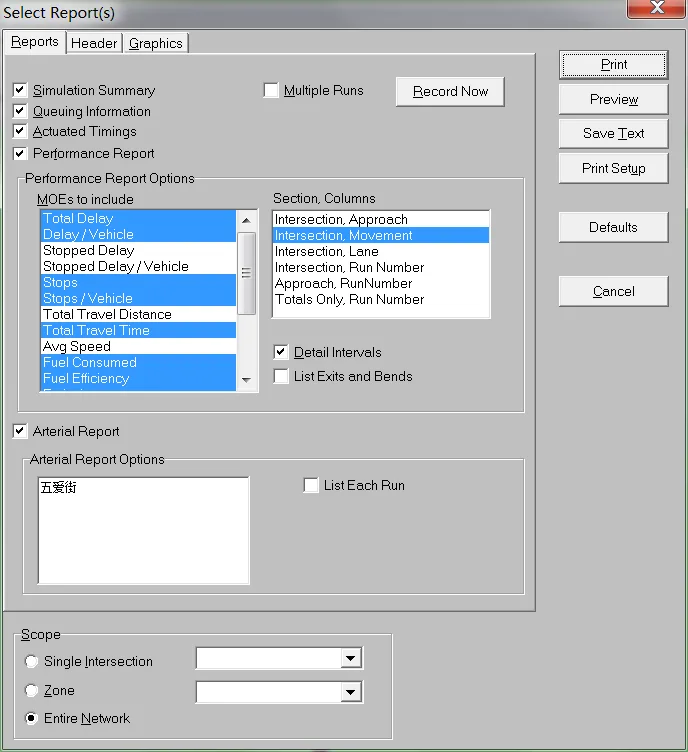
Figure 13: Output parameter settings in SimTraffic
Within the output options, select evaluation metrics from “MOEs to include.” To export mainline-specific reports, enable the “Arterial Report” checkbox. SimTraffic generates indicators such as stop frequency, delay, fuel consumption, and emissions of hydrocarbons, carbon monoxide, and nitrogen oxides for each lane at intersections. An example of the output TXT report is shown in Figure 14:
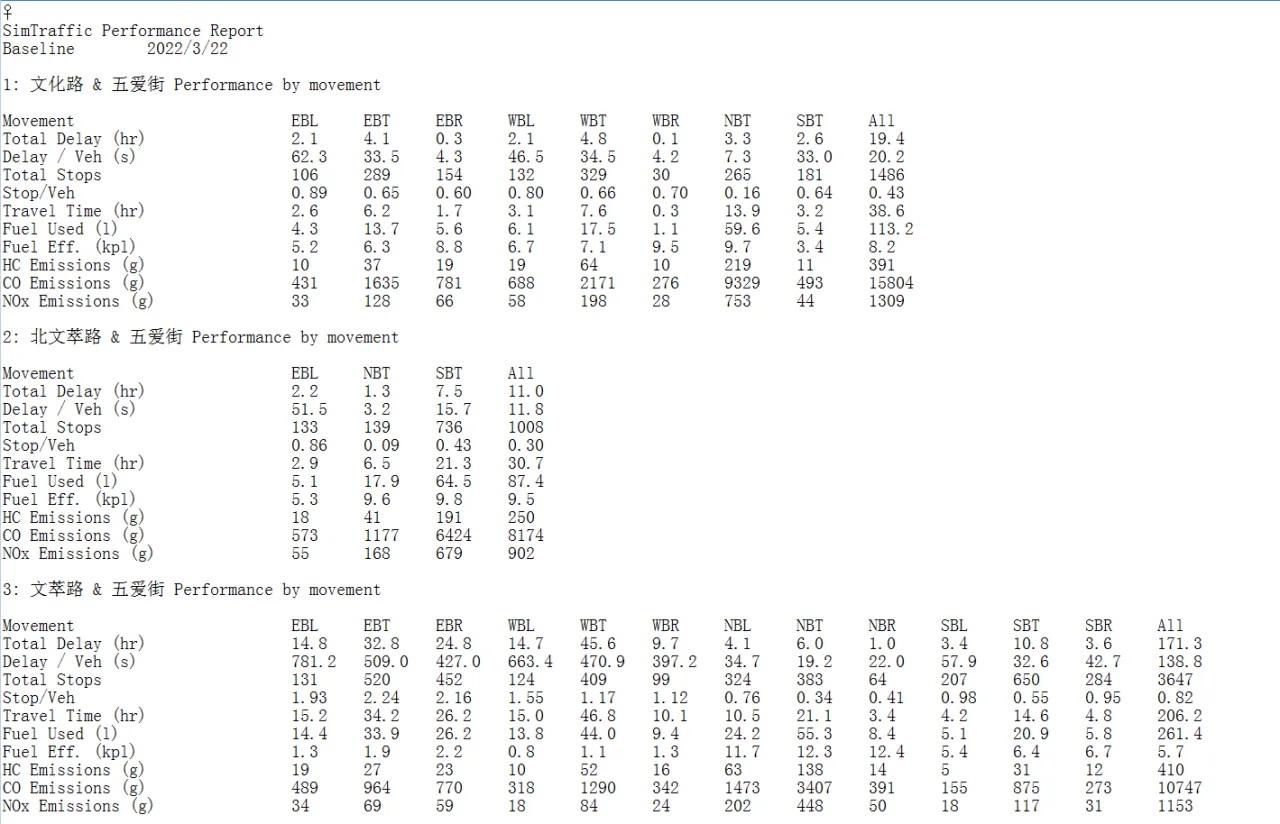
Figure 14: Example of SimTraffic output data
Using Synchro’s time-space diagrams, you can clearly visualize the green wave progress after phase adjustments. SimTraffic simulations allow comparison of delay, stop frequency, and environmental impact before and after signal timing optimization for each lane at every intersection.
Overall, Synchro is a versatile, user-friendly software with low hardware requirements, widely used for urban road signal timing and coordination. Its powerful features and accurate simulations make it a preferred tool among traffic management and control professionals.


Must log in before commenting!
Sign Up