b. Construction Drawing Design
The construction drawing design phase focuses on refining the preliminary design model and associated documentation. This includes detailing the size and location of pipelines passing through beams and structural reserved openings, precise installation points for large mechanical equipment, and the positioning of specialized pipe fittings and equipment for water supply, drainage, HVAC, and power systems. At this stage, the model’s accuracy must meet the LOD300 standard as required by the relevant owner units. Since the design process closely follows that of the preliminary design, it will not be repeated here. Figure 11 illustrates the decoration model for the station’s equipment and public areas.
Building upon the enhanced and deepened model, the model application engineer advances the model’s application level. This involves not only performing clash detection among various disciplines but also generating essential 2D and 3D engineering drawings from the BIM models, such as plans, elevations, sections, 3D spatial analyses, and pipeline layout analyses. The following sections highlight key applications of the model by the engineer during this stage.
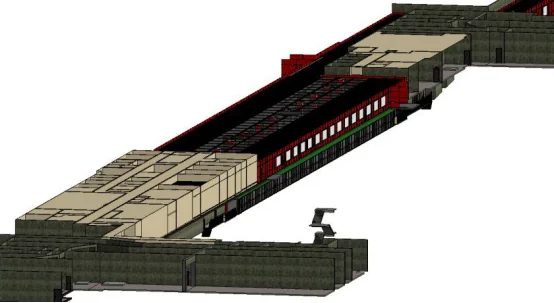
Figure 11: 3D Model of Decoration
(1) Clash Detection
During the construction drawing phase, once the model is created, various discipline models are linked into a single project file to form a comprehensive integrated model. The model application engineer then conducts clash detection between components and pipelines across disciplines. Given the complexity of the pipeline system at this stage, Navisworks is preferred over Revit’s native clash detection for its faster search speed and superior display capabilities, especially regarding clash locations, types, and quantities. Navisworks also offers more comprehensive clash reports, as shown in Figure 12.
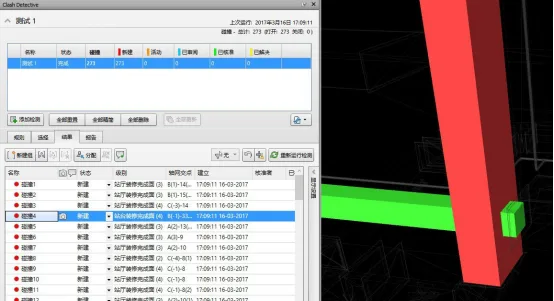
Figure 12: Clash Detection Results
After integrating the models, the entire project’s .nwc file is exported via Revit with linked files converted in the export settings. These files are then imported into Navisworks to generate the integrated model. The “Clash Detective” tool is used to run clash detection, focusing on hard clashes typical in pipeline conflicts. The results appear on the left panel, while the specific conflicting components are highlighted on the right for easy identification.
This process allows quick identification of the exact number and locations of clashes, with components displayed prominently. To facilitate design optimization, Navisworks generates detailed clash detection reports containing images and precise descriptions of each clash location. These reports enable all stakeholders to offer clearer, more actionable optimization suggestions, as depicted in Figure 13.
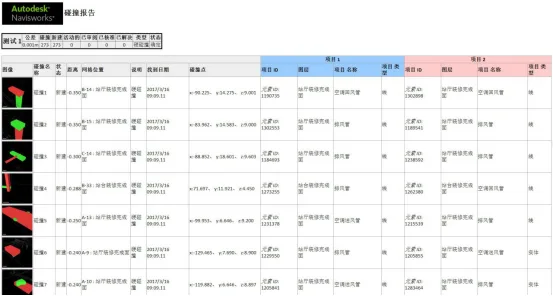
Figure 13: Clash Detection Report
(2) Design Optimization
Once clash detection is complete, under the guidance of each discipline’s BIM coordinator, the design models are adjusted according to the agreed collision avoidance measures. The goal is to eliminate all clashes between disciplines, optimize the spatial arrangement of components, reduce construction modifications, and lower project costs, as shown in Figure 14.
For example, water supply and drainage pipes near the C-axis and 33rd axis on the subway station’s underground level were found to clash with air conditioning water pipes in the HVAC system. The air conditioning pipe is a 200mm diameter seamless steel pipe carrying chilled return water, while the water supply pipe is a 40mm diameter pipe for production and domestic water. According to the collision agreement, smaller pipes must be rerouted around larger pipes, and bent pipes replaced with straight sections where possible. Consequently, the drainage pipe was raised by 125mm to pass above the air conditioning pipe.
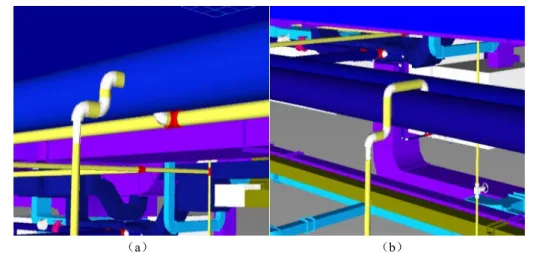
Figure 14: Clash Resolution and Optimization
Additionally, Navisworks’ walkthrough and measurement tools help evaluate the spatial layout of pipelines and equipment. This enables the identification of unreasonable spatial arrangements, ensuring smooth installation processes and providing sufficient access space for maintenance personnel during operation.
(3) Quantity Takeoff and Model Drawing
Quantity Takeoff: After completing the construction drawing model, Revit is used to calculate quantities for various disciplines, including counts, volumes, areas, and other material and equipment data relevant to station construction, as shown in Figure 15.
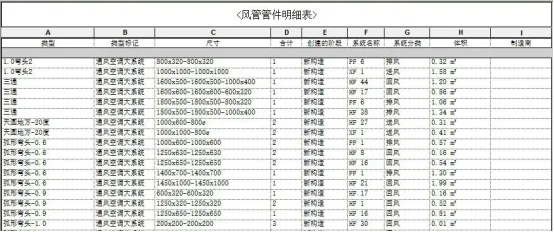
Figure 15: Detailed Bill of Quantities
Model application engineers generate corresponding statistical reports in Revit based on project requirements and export them. These reports provide accurate and realistic data, allowing cost estimators to calculate the precise quantities needed for each discipline or system.
In practice, generating an accurate bill of quantities depends on two key factors: first, the model’s accuracy, as precise geometric data such as component dimensions directly influence calculations of area and volume. Second, the thorough input of relevant metadata, including manufacturer details, categories, model numbers, and thermal properties of mechanical equipment and materials, which affects quantity estimates.
Model Drawing: Construction still depends heavily on drawings. After comprehensive optimization of professional models, these optimized models are used to produce design deliverables. Revit, as a powerful 3D design tool, can export files in formats such as RVT, DWG, NWC, and IFC, and generate various 2D and 3D drawings based on project needs to guide construction.
The complex pipeline systems of subway projects involve many disciplines and limited construction space. Construction based solely on floor plans is challenging. By combining 3D drawings of complex parts with 2D plans, construction personnel gain a clearer understanding of the design intent, reducing errors, as shown in Figure 16.
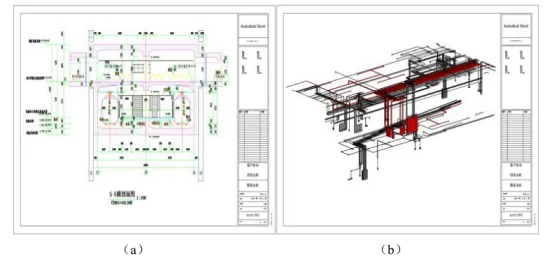
Figure 16: Drawing Output
Once the model is finalized, owners can use VR technology to virtually explore the subway station, providing a more intuitive understanding of how the completed construction will look. This helps ensure the design meets actual needs and makes the construction process more transparent and accurate through 3D visualization.
Dong Fuwen (Xi’an University of Technology)
For learning and communication purposes only. Copyright belongs to the original author. If any infringement occurs, please contact us for removal.


Must log in before commenting!
Sign Up