This article is brought to you by the official account: ACND STUDIOS.
Overview
This guide explains how to quickly generate terrain models in Grasshopper using CAD elevation points and elevation data.
Required files: CAD terrain files
Required software: Rhino, Grasshopper
Plugins: Human, Weaverbird, Meshtools, Meshedit (can be downloaded from the Food4Rhino website or the official plugin sites)
1. Initial Setup
Step 1:
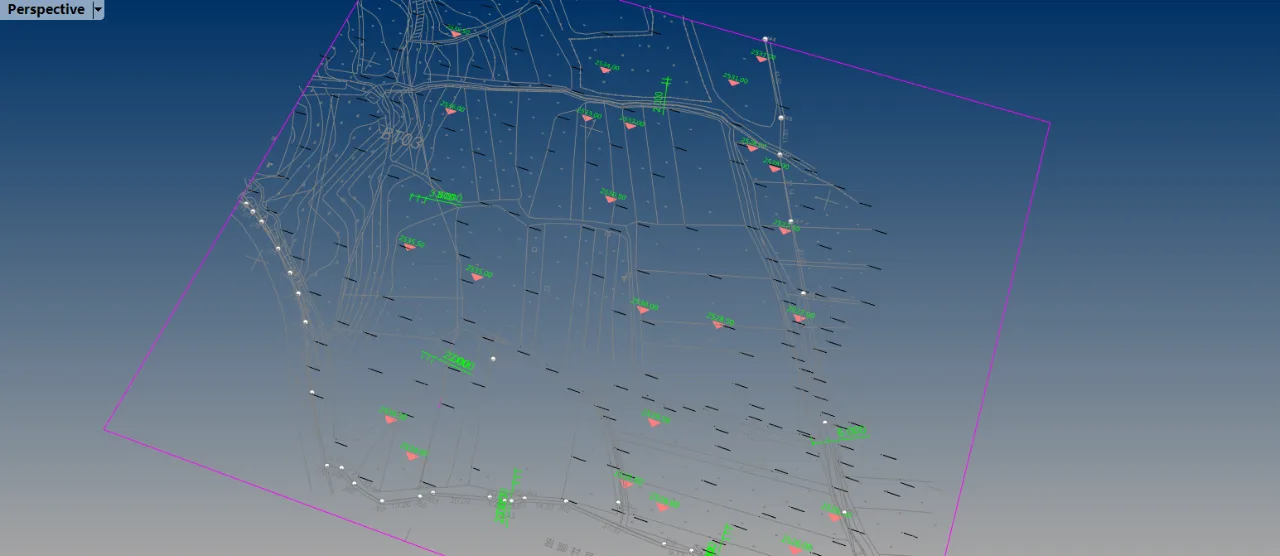
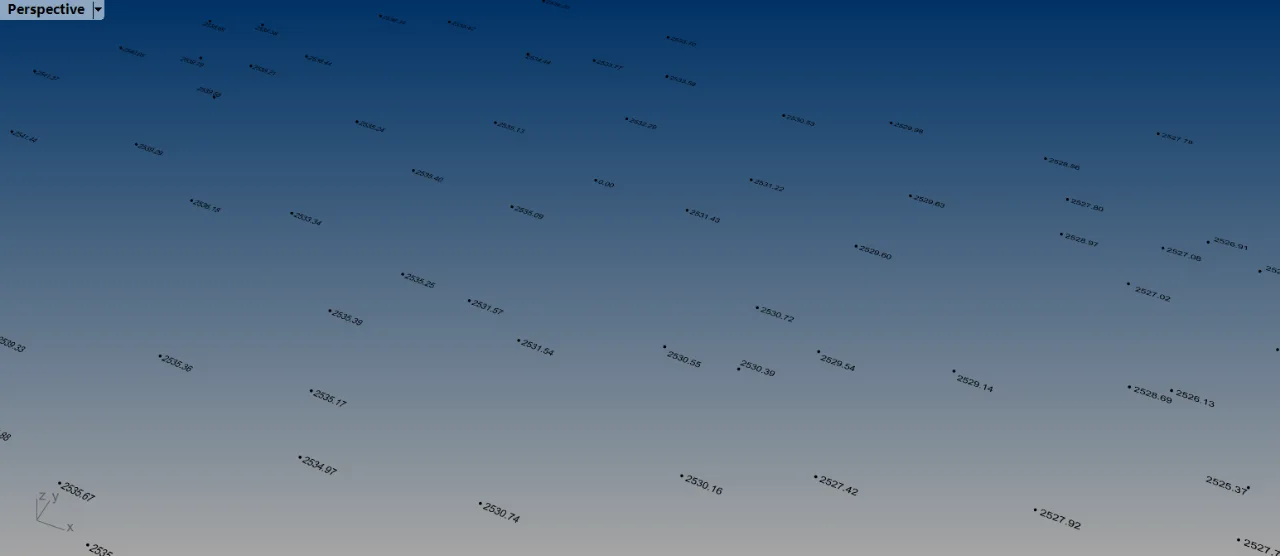
Import the CAD terrain file into Rhino. If the import fails or data is missing, convert the CAD file to an earlier version or use Tianzheng to convert to T3 format before importing. We only need elevation points and their corresponding elevation text data. Use the group command to separately group the elevation numbers and point selections. It’s recommended to copy these two groups into a separate Rhino file to avoid conflicts when selecting text later on.
Ensure each elevation point corresponds to one elevation text. Some CAD drawings may have incomplete or duplicated data. Use Rhino’s SelDup command to find duplicate objects, and SelPt and SelText to quickly select points and text respectively. If your data is organized in layers, use SelLayer to select by layer.
2. Terrain Generation
2.1 Data Extraction
Step 2.1:
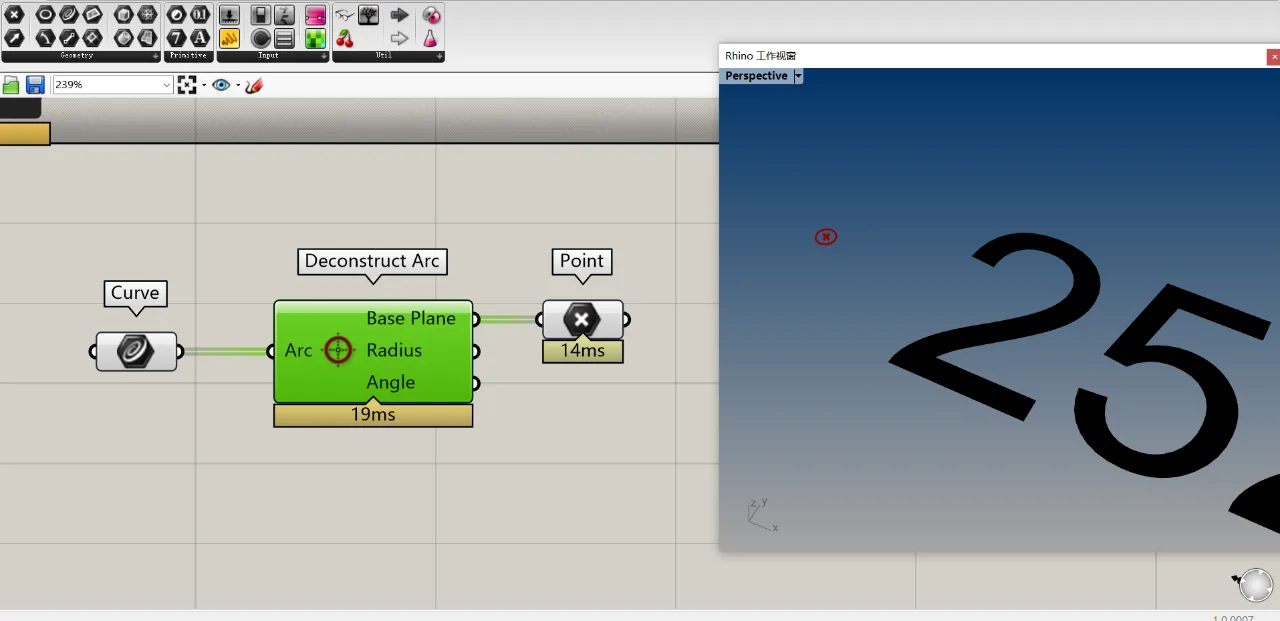
In this example, the CAD elevation points are circular shapes. We need to import all these circular curves into Grasshopper and calculate their centers. Note that elevation points or numbers are often grouped into blocks in CAD; remember to explode these blocks before working in Grasshopper.
Step 2.1 (continued):
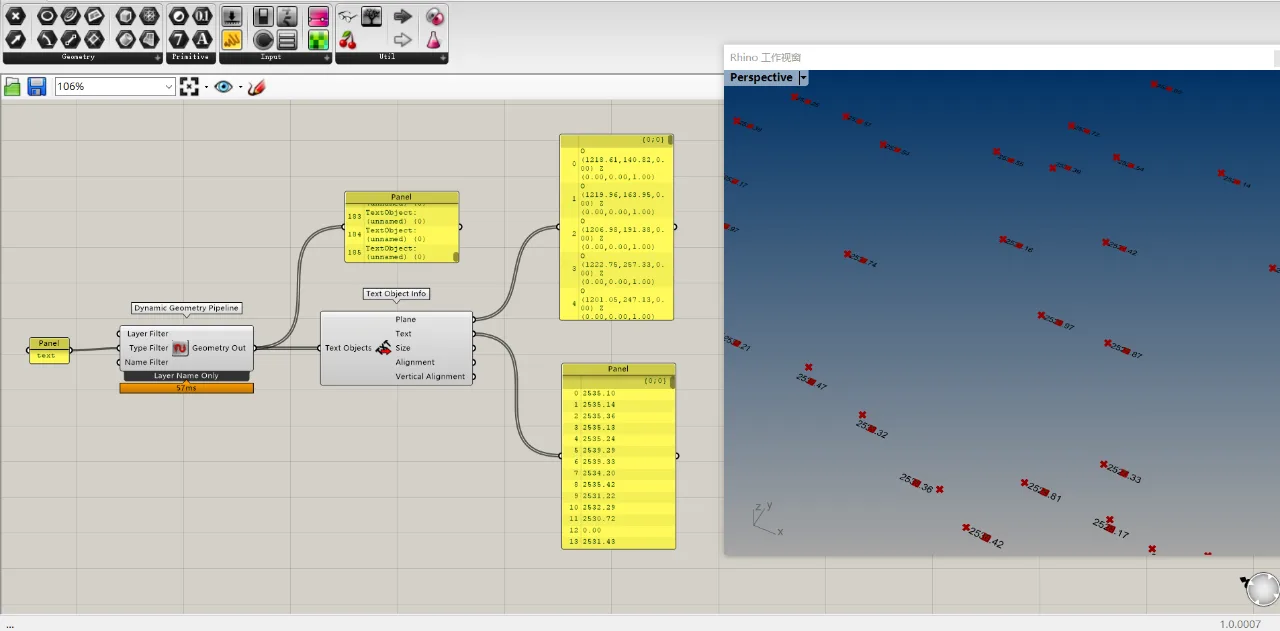
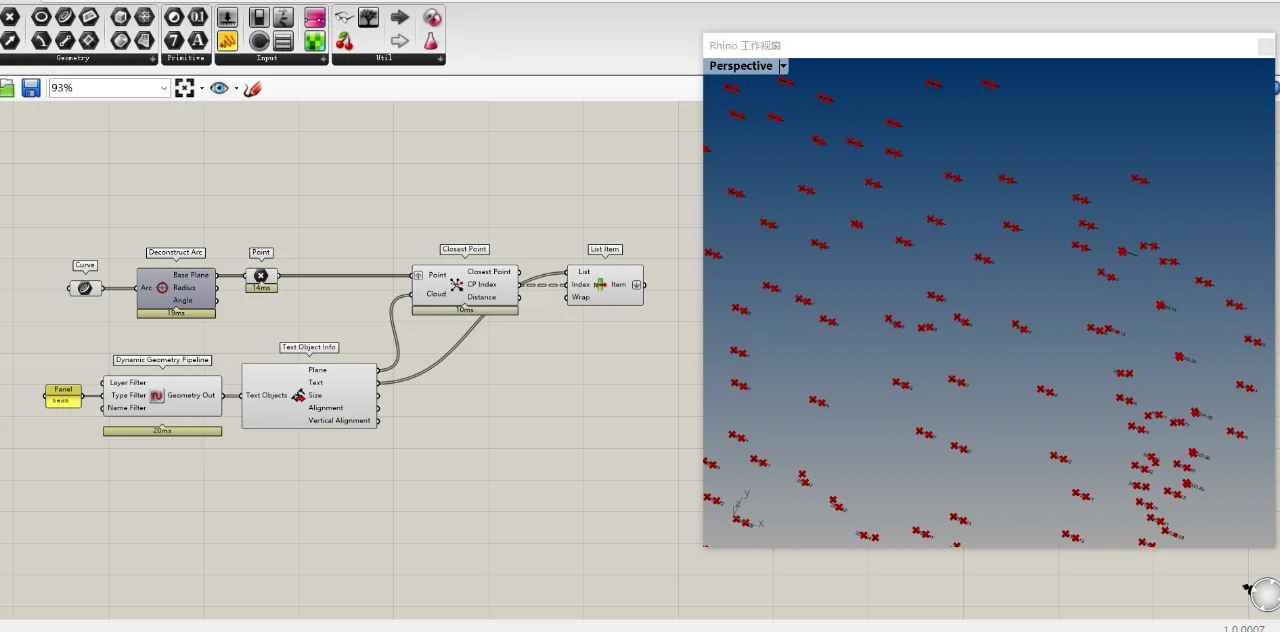
Use the Dynamic Geometry Pipeline component from the Human plugin to import text objects from Rhino into Grasshopper. This component allows you to filter objects by layer, type, or name. Here, we use the selection filter option. Initially, the output geometry is text without data, so use the Text Object Info component to extract details such as the text plane, content, and size.
2.2 Matching Elevation Points to Text
Step 2.2:
Since the previous step simply collected all circles and text without order, the points and texts don’t correspond correctly. To fix this, use the Closest Point component to find the nearest text to each circle’s center.
This step may require a moment to understand. Each circle’s center point should be placed in a separate group (or “bag”), while the text points remain in a flat list. This setup ensures each center point finds its closest matching text point correctly. If both inputs were flat lists, the matching would fail.
Step 2.2 (continued):
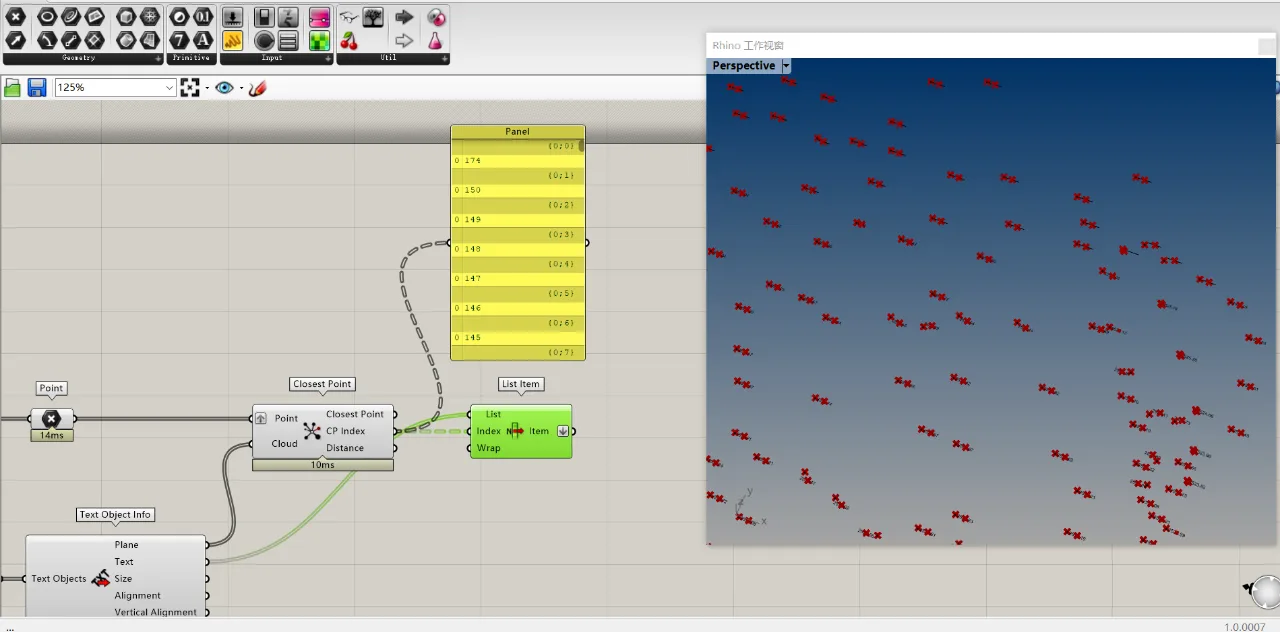
Using the Closest Point component provides the index of the nearest text for each circle center. Use these indices with the List Item component to extract matching text from the list. Make sure the circle centers and text share the same list structure to synchronize them properly.
Note: The List Item input here is text objects (not planes), because the order of planes matches that of the text, and we ultimately need the text data. Essentially, this step reorders the text to align with the circle centers.
Step 2.2 (validation):
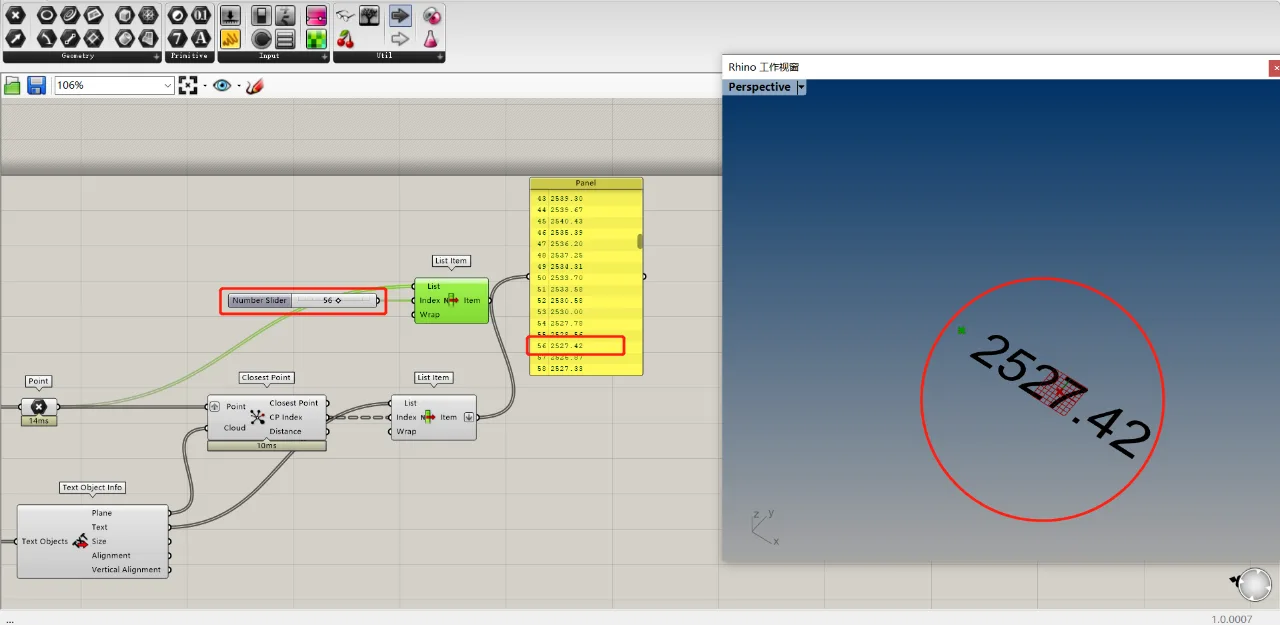
If you want to verify results, randomly select points using List Item and middle-click the component to zoom in and check if the matched data corresponds correctly to the original list.
2.3 Creating the Terrain Surface
Step 2.3:
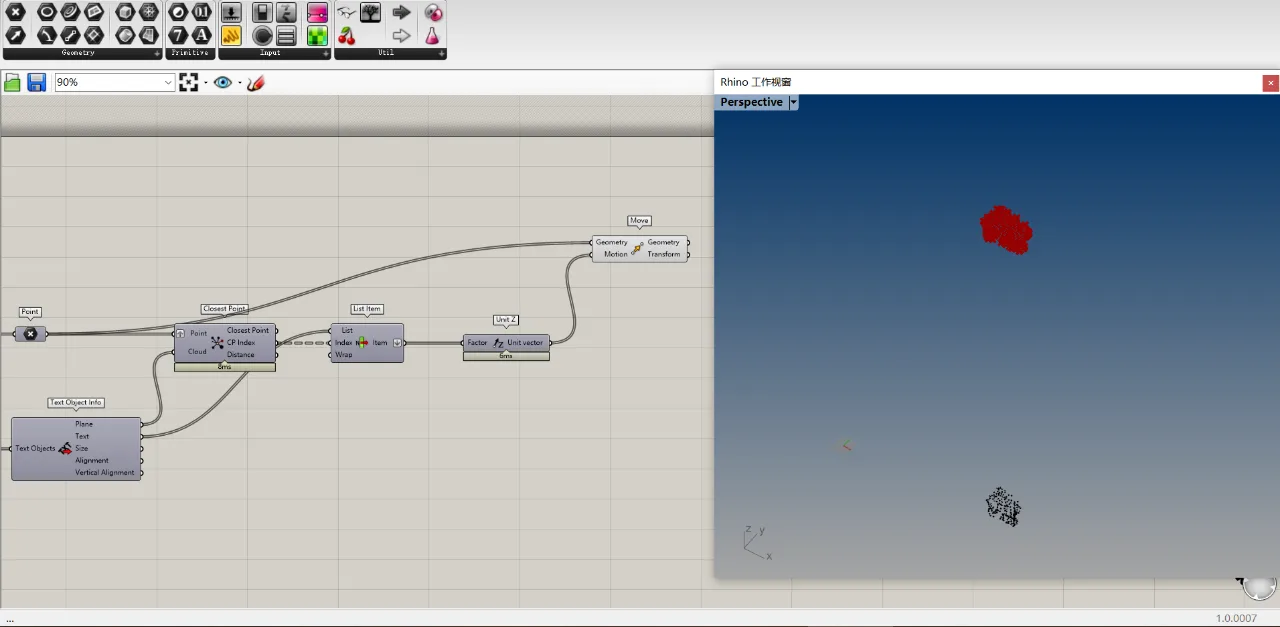
Use the Move component combined with a Z-axis vector to raise the elevation points according to their elevation values.
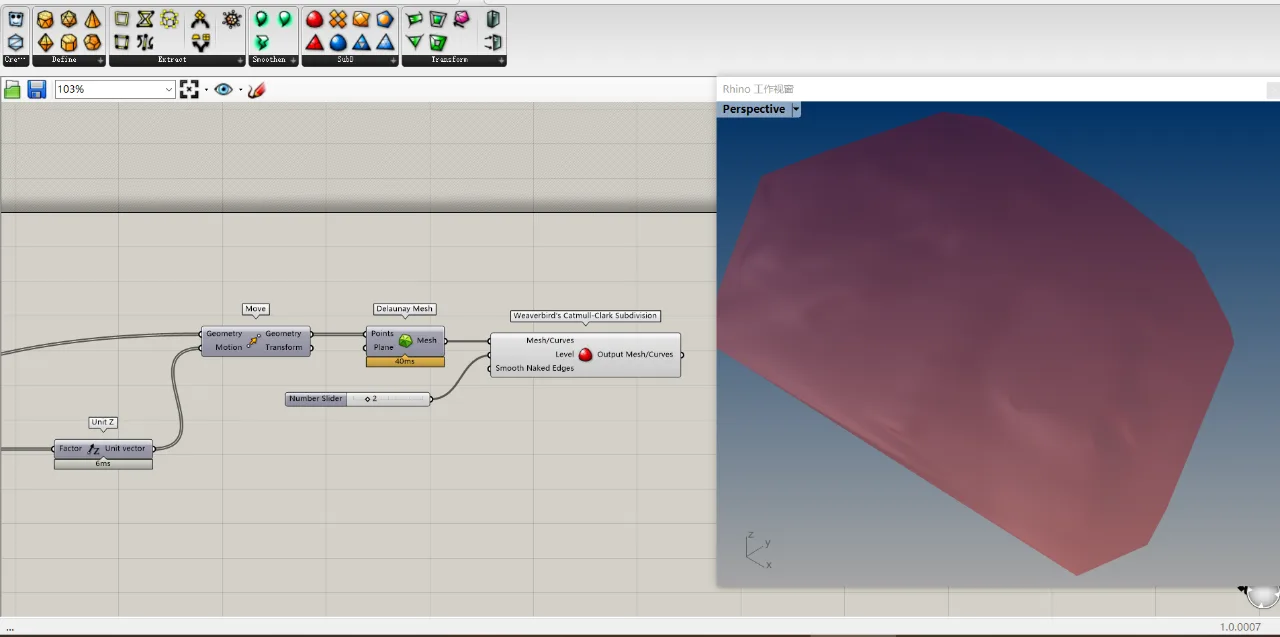
Step 2.3 (continued):
Generate faces using the Delaunay Mesh component. If the mesh faces appear too sharp, the Weaverbird plugin’s Subdivision component can be used to smooth them.
3. Final Touches
3.1 Contour Lines
Step 3.1:
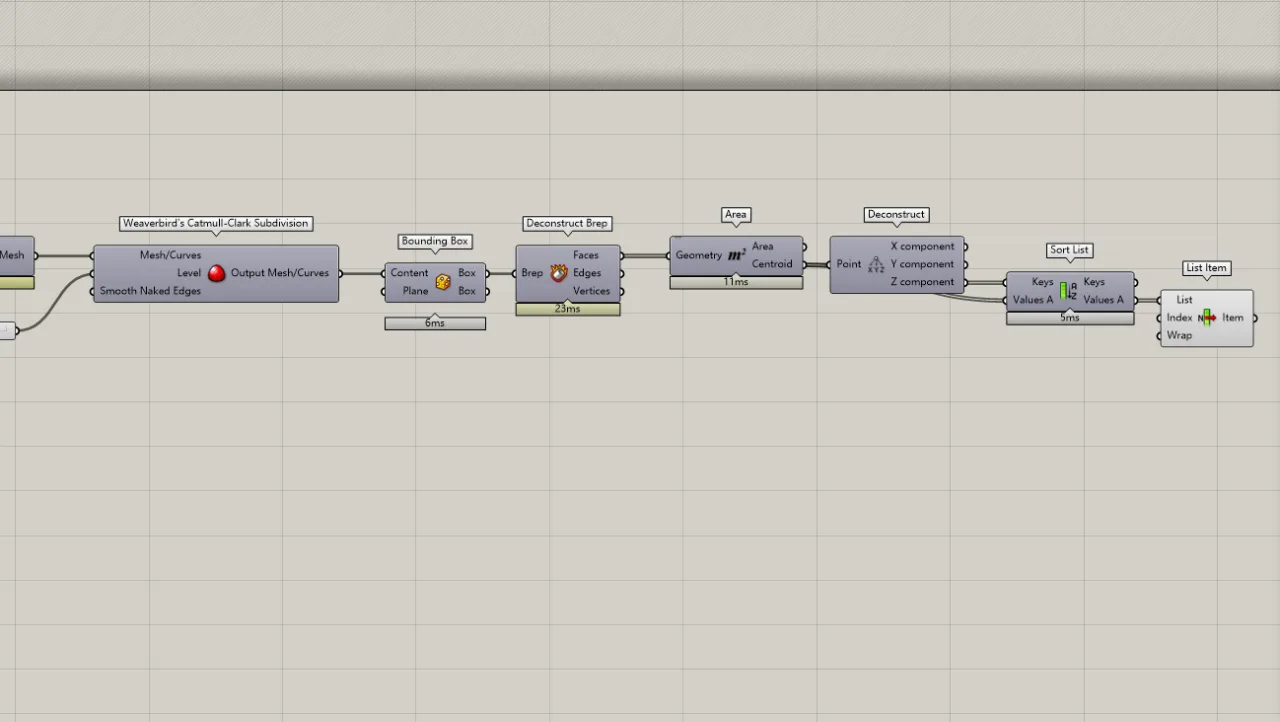
Similar to the Contour command in Rhino, start by creating an external bounding box around the terrain using the BoundingBox component. Explode the box to get the center point of each face, then decompose these points into X, Y, and Z coordinates.
Sort the Z coordinates using the Sort List component, connecting the initial area center point to the value input. This sorts the center points from lowest to highest based on elevation. The first point from the sorted list is the lowest elevation.
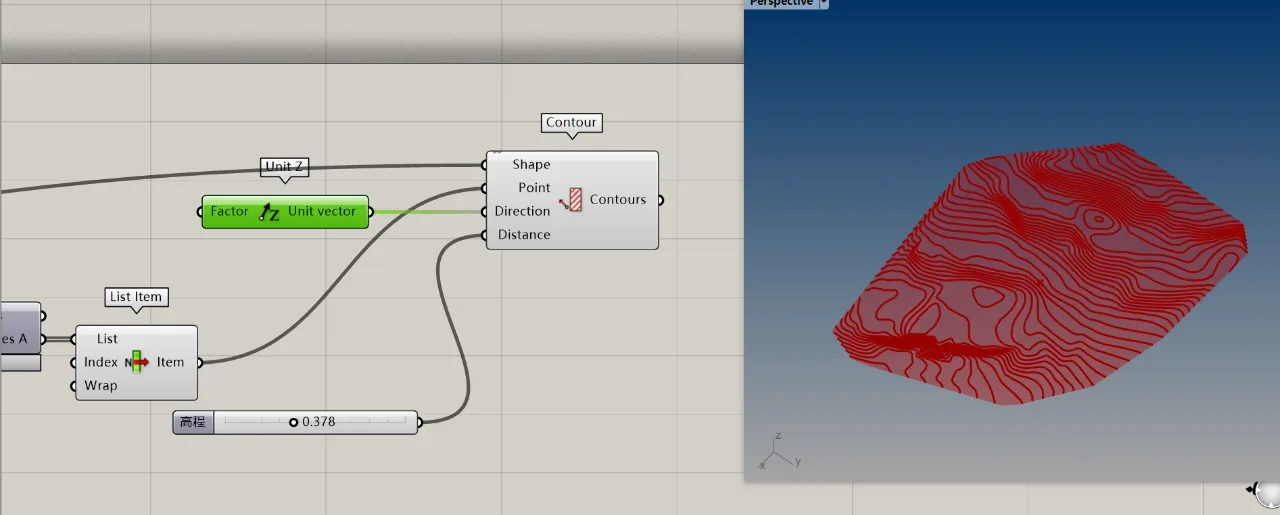
Step 3.1 (continued):
Use the Contour component to generate contour lines across the surface at your specified elevation intervals, enabling you to analyze the terrain slope.
3.2 Color Mapping
Step 3.2:
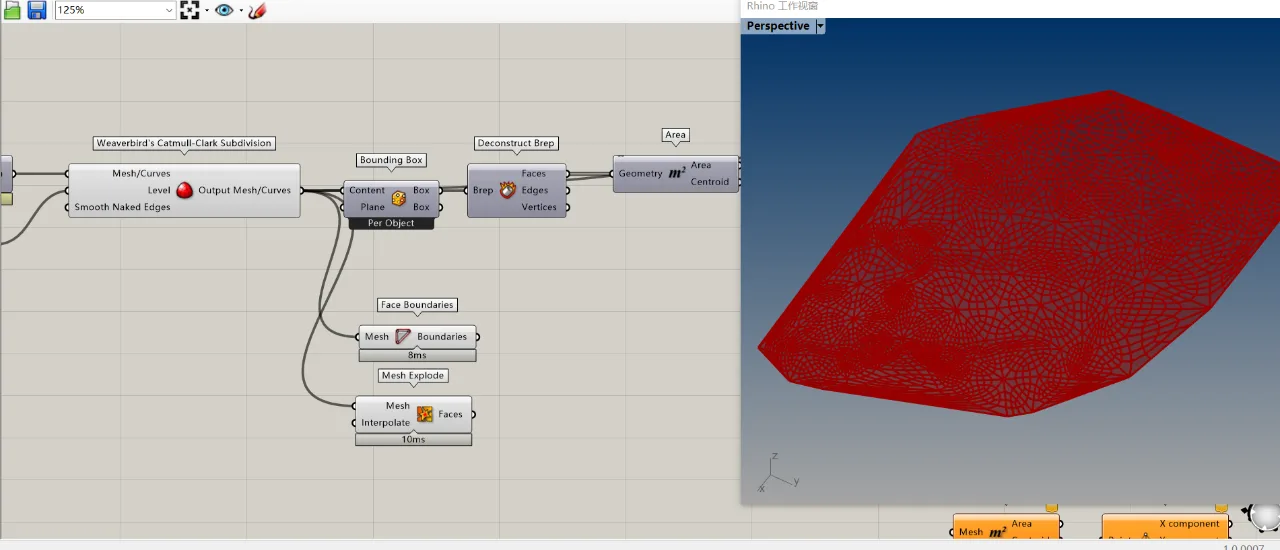
Use the Face Boundaries component to visualize the subdivided mesh by exploding the output from the Subdivision step.
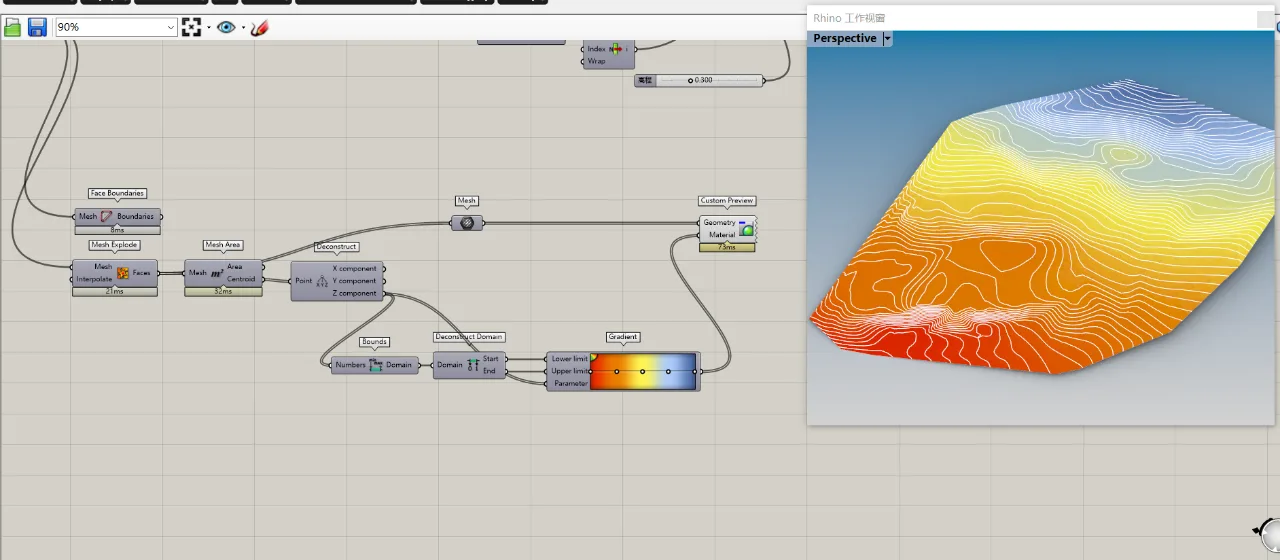
Step 3.2 (continued):
Apply gradient coloring based on the Z-coordinate of each mesh face’s center point. This helps visualize the elevation distribution across the terrain model.


Must log in before commenting!
Sign Up