During the design phase of construction drawings, it is essential to budget accurately for each individual or unit project to establish a clear planned price. Importantly, the budget must not exceed the estimated investment portion. Effective budgeting requires precise measurement of work quantities, optimization of the budgeting process, and clear definition of the work scope. Traditionally, calculating the engineering quantities involved manually using construction drawings and corresponding rules, which was time-consuming and labor-intensive. The engineering cost program discussed here simulates manual calculation methods and procedures, automating these tasks by replacing manual labor with computer processing.
1. Calculating Engineering Quantities
Using CAD versions from 2006 or 2011, the Luban calculation program can be installed to replicate manual calculation concepts and steps. The modeling process in the program follows similar steps: create a new project, build a grid, form components, retrieve lists and quotas, perform statistical calculations, and finally output the report.
Step 1: Building a Cost Model
Begin by creating a new construction project. Before constructing the model, thorough preparation is necessary, including selecting the appropriate templates and calculation modes, entering basic floor information, and setting material properties. When initializing a new project, choosing a suitable attribute template is crucial. If the project closely resembles an existing model, its properties can be used as a template, with adjustments made to floor and component properties (excluding graphics) to improve efficiency.
For pipeline installation projects, the general information should reflect the actual project conditions, including the project name, address, structural and construction types, and all participating parties. Providing complete and detailed information is vital. The calculation mode should be chosen reasonably, and the list and quota libraries should be allocated appropriately for each region.
Step 2: Constructing a Grid
The next step in modeling is establishing a grid, which serves as the foundation for drawing components. The grid network consists of main and secondary axes. The main axes remain consistent across all floors—modifications on one floor’s main axis synchronously update others. Secondary axes are unique to each floor. The grid can be constructed manually or by using a drawing extraction mode. If the spacing between the main axes is consistent on each floor, adjusting the drawing first and then extracting the grid axes is a convenient approach.
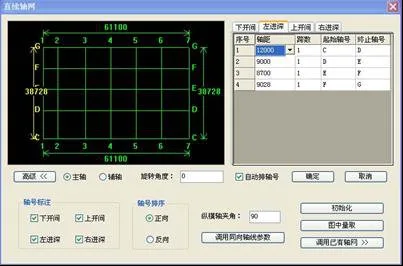
Figure 1: Screenshot showing the first-floor spindle dimensions of a specific project
Step 3: Drawing Components
After the grid is set, the model can be constructed based on the drawings. First, convert the drawing information into the software, allowing it to automatically calculate the engineering quantities. In BIM models, component properties such as wall thickness and beam sections are well defined. These properties should be assigned based on the drawings and aligned with the grid.
However, some complex projects contain extensive and detailed drawing information. Drawing components individually can be time-consuming, resource-intensive, and prone to human error.
Step 4: Calculating Engineering Quantities
Once all graphics are converted, it is important to accurately obtain the list or quota for each component, then calculate project quantities and generate reports. The Luban program supports various regional quota databases and adheres to calculation rules, which are dynamically updated to address regional challenges in engineering cost estimation.
Quantity calculation is performed through two main methods:
- Visual Verification: This allows detailed inspection of quantities and formulas for individual components. For example, when calculating the concrete volume for a specific frame beam, calculations are refined to eliminate overestimation or under-deduction, helping identify anomalies or statistical errors.
- Quantity Calculation Instructions: This method calculates the overall project quantity and produces a comprehensive quantity report. The report includes component positions, quantities, calculation formulas, and deduction relationships between components. These can be quickly retrieved using reverse search based on graphics.
2. Cost Estimation
Pipeline installation engineering costs can be divided into stages, including sub-item engineering costs, strategic project costs, regulatory fees, taxes, and more. This section focuses on the advantages of using the Luban cost program for calculating costs at each stage.
The program builds cost model lists and quota data, integrates both 2D and 3D models, and exports files in .tozj format. This enables the generation of preliminary cost files that can be directly utilized by other systems.
The budget book allows users to view formulas and corresponding component positions to verify consistency between the program’s calculated quantities and the actual engineering quantities. It also supports reverse checking by linking graphics and formulas, ensuring an organic connection between visual data and calculations.
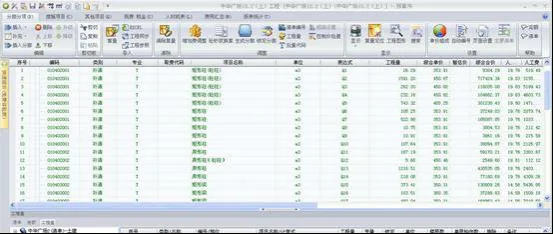
Figure 2: Interface of the sub-item project budget book
The selected template during project setup determines the unit price for sub-item engineering costs, regulatory fees, and taxes. The program automatically calculates engineering costs based on contracting conditions and project types, applying appropriate rates. If the actual project differs from the template, the program allows adjustments accordingly. Other project costs are calculated based on specific circumstances.
The program features a macro variable editor for formula customization. Default formulas can be modified to suit requirements, supporting multiple charging modes. This intelligence and flexibility greatly enhance convenience. Once changes are finalized, costs are automatically integrated into the total project cost without manual intervention, ensuring accuracy and reliability.
After determining the total project cost, the program generates summarized reports. A variety of templates and report formats are available, allowing enterprises to select, design, generate, and save default templates tailored to their needs.


Must log in before commenting!
Sign Up